This quarterly data report details industry-specific statistics compiled from hundreds of cell therapy, gene therapy, tissue engineering, and other regenerative medicine therapeutic developers worldwide, including total financings, partnerships and other deals, clinical trial information, key clinical data events, and ARM’s current strategic priorities.

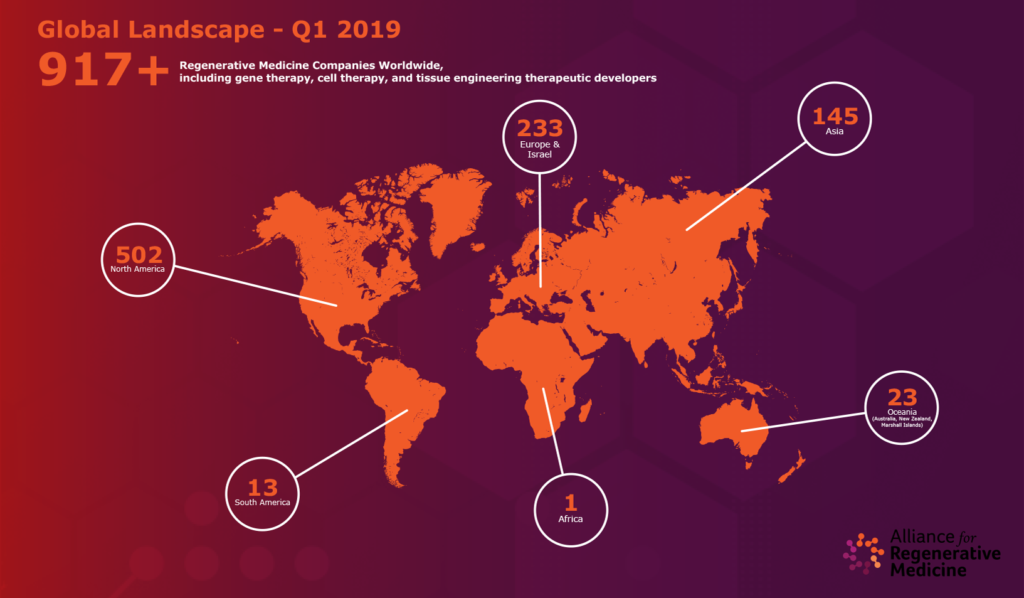
Regenerative Medicine Companies
Worldwide, Including Gene and
Cell Therapies, and Tissue Engineering
Therapeutic Developers
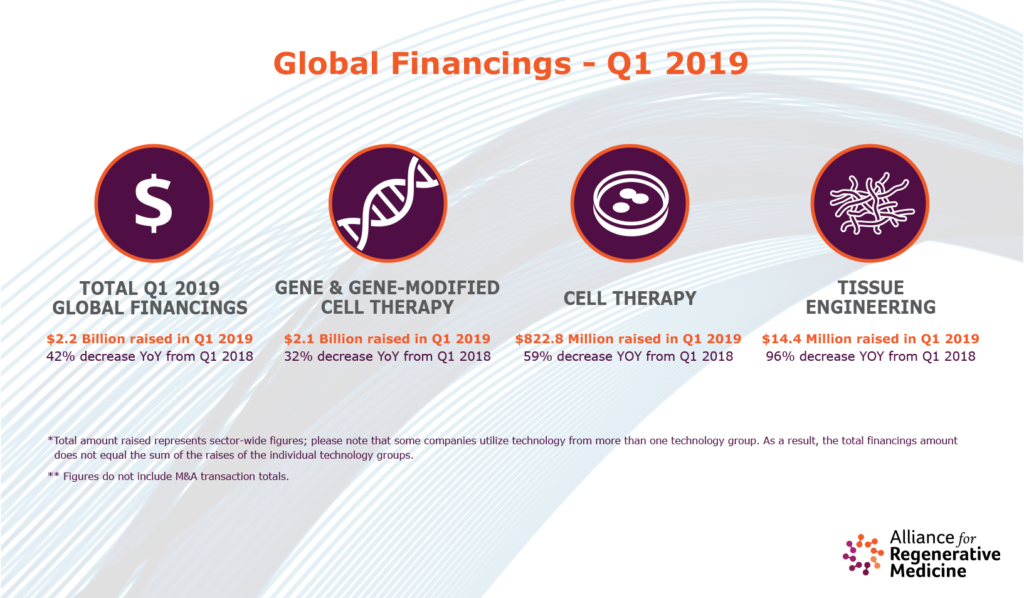
Decrease from Q1 2018
Decrease from Q1 2018
Decrease from Q1 2018
Decrease from Q1 2018
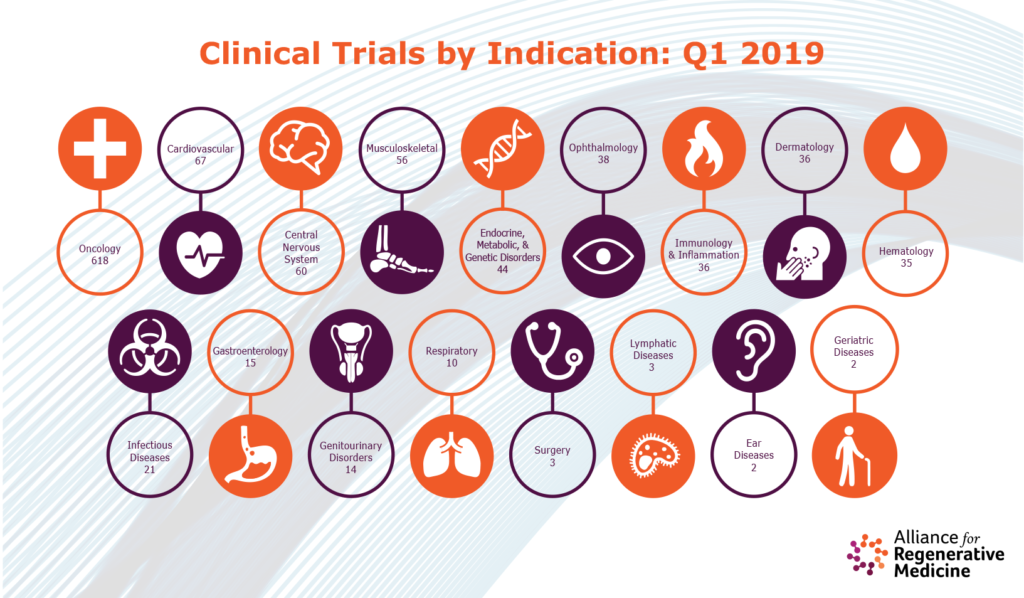
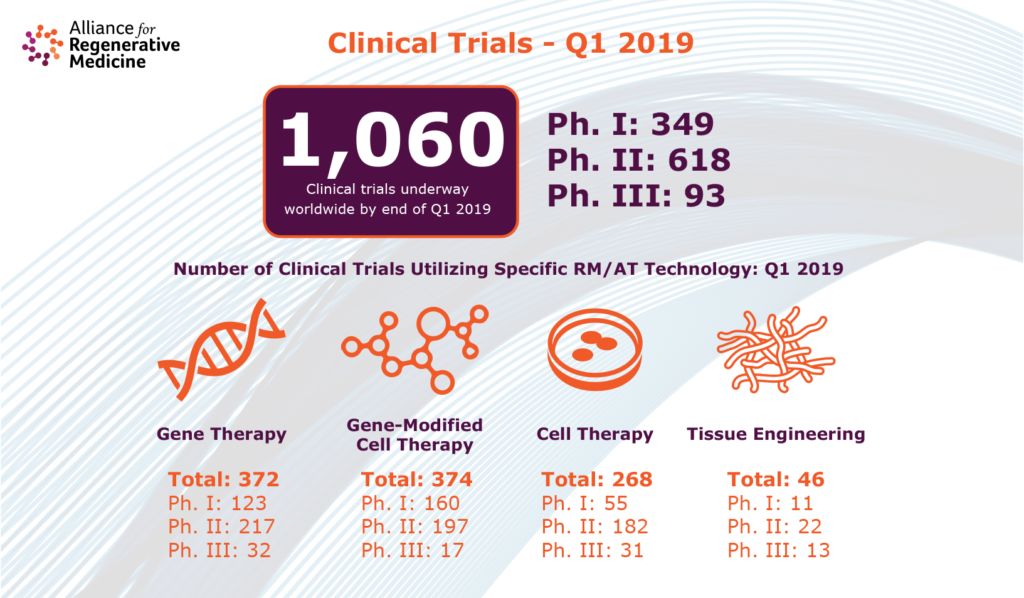
1,060
Clinical trials underway
worldwide by the end of Q1 2019
349
618
93