This report assembles a global sector overview, including details on financings, partnerships and other deals, clinical trial information, major clinical data events, and ARM’s current legislative and regulatory priorities.

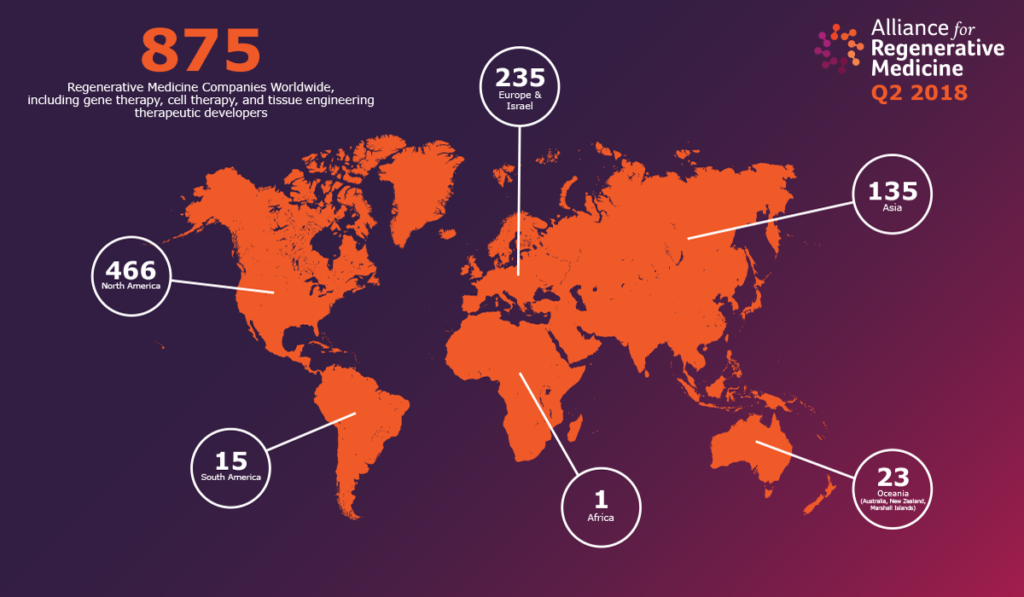
Regenerative Medicine Companies
Worldwide, Including Gene and
Cell Therapies, and Tissue Engineering
Therapeutic Developers
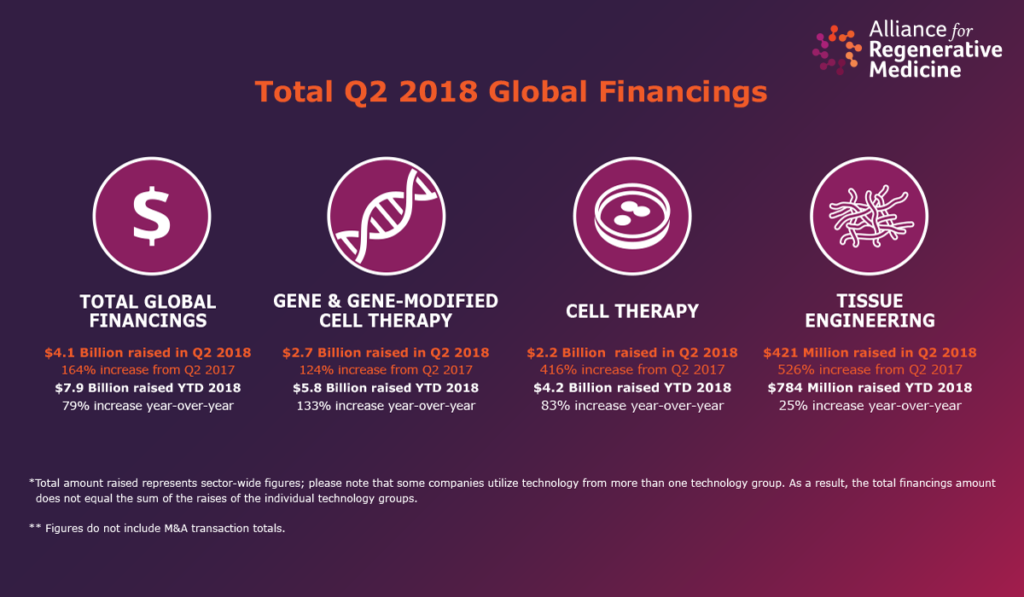
Increase from Q2 2017
Increase year-over-year
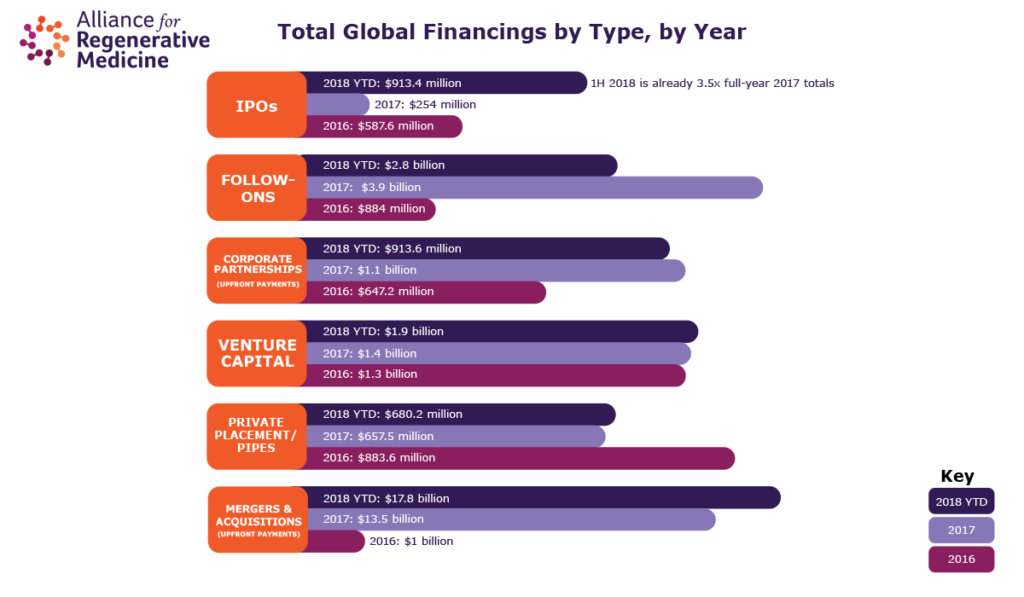
$7.9B Raised YTD 2018
Increase from Q2 2017
Increase year-over-year
$5.8B raised YTD 2018
Increase from Q2 2017
Increase year-over-year
$4.2B raised YTD 2018
Increase from Q2 2017
Increase year-over-year
$784M raised YTD 2018
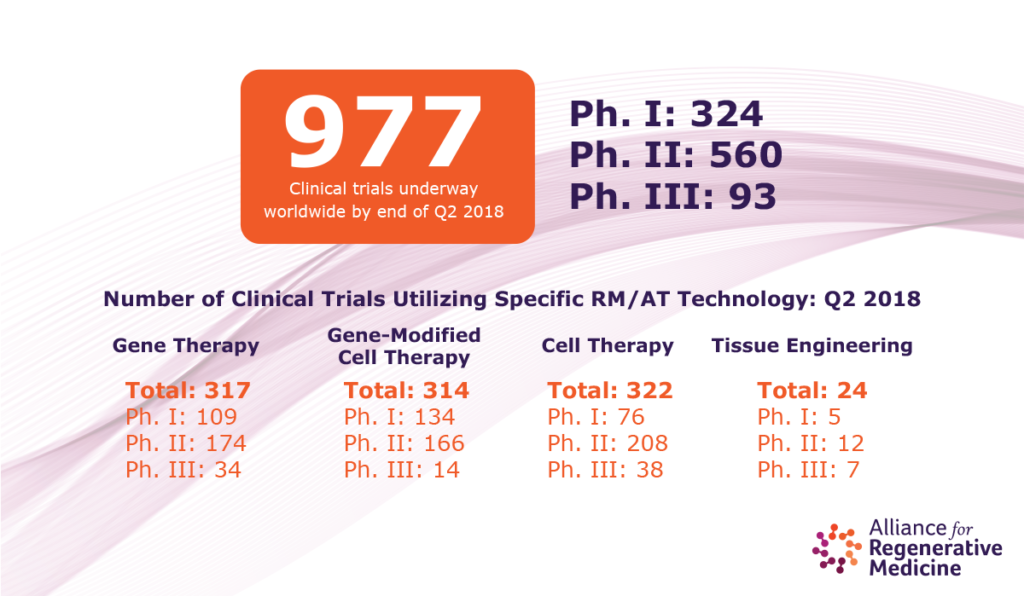
977
Clinical trials underway
worldwide by the end of Q2 2018
324
560
93